Why AI visibility is hard to measure (Part 1)
The measurement problems underneath AI visibility metrics.

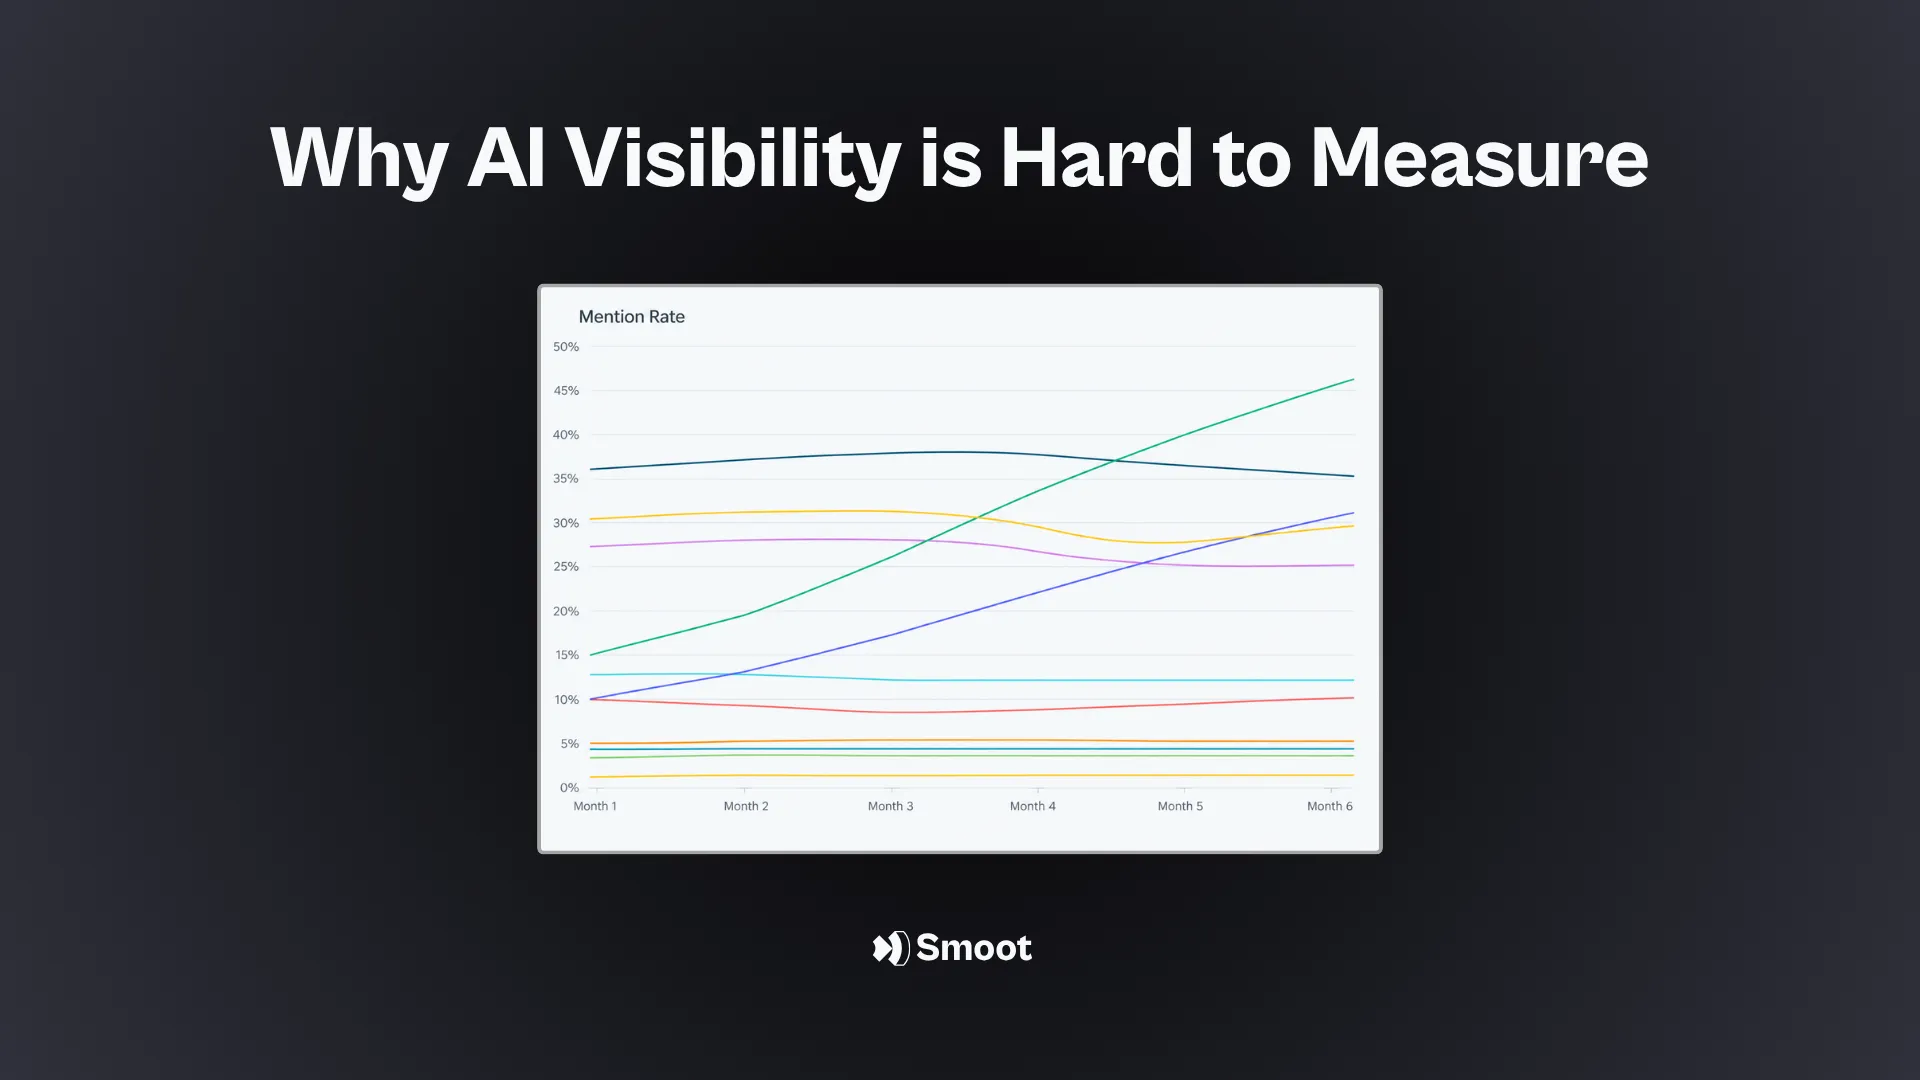
Part one outlines the confounding factors for measuring brand visibility in AI answers and connecting it to business outcomes. We then suggest strategic frames to navigate these challenges.
In the upcoming second part, we will evaluate 5 current AI visibility metrics for their strengths and weaknesses.
We surveyed recent academic, industry, vendor, and practitioner research on GEO measurement. Current measurement techniques still have a number of methodological problems, particularly when it comes to reliably connecting them to business outcomes.
The goal of this article is to systematically outline and explain the key challenges to accurate AI visibility measurement. To do this, we looked at a broad range of data and reporting from AI visibility vendors, economic authorities, and academic analysts.
Summary
- KPIs for GEO and AI search visibility are still unsettled. The field is new, but that is not the whole reason. Three problems keep them unsettled: model changes, personalization, and attribution.
- Accurate data processing and accurate measurement are not the same thing. Tools disagree because they define metrics differently and have varying rates of false negatives and positives. Yet even a tool that reads answers perfectly can misrepresent how visible that brand is in AI answers.
- LLM and platform updates change behavior, and vendors have little reason to keep things stable. When a model or its tooling updates, retrieval and output can change overnight. New capability drives adoption, which vendors urgently need, so big updates keep coming.
- Personalization changes retrieval and output, but no one knows how much. ChatGPT has personalization on by default. No one can say how representative a scraped answer is.
- Outcomes rarely connect to measurements. AI answers get read but not clicked. Standard attribution credits other channels.
- Treat metrics as strategic signals, not success benchmarks. Chasing one number leads to reactive calls. Work with these limits, not against them.
Why do analytics tools disagree?
Key Points:
- Tools define visibility differently, so they report different numbers. The same brand across 7 tools came back up to 8.2x apart, driven mostly by what each counts as a mention or citation.
- Detection errors have compounding downstream effects. Missed and extra mentions scale every number above them, and miss rates are almost never published.
- Accurate data processing and accurate measurement are not the same thing. A tool may be precise, but what marketers care about is whether or not the number in the dashboard represents reality.
Teams must measure something in order to build strategies and report to leadership. Analytics vendors and agencies sell simplicity and clarity by offering a single number. Practitioners may lose sight of strategy by chasing that number.
As reported in Digiday, many marketers have noticed that different AI visibility monitoring tools often produce different results.
In a modestly sized but frequently cited study, Ken Imoto illustrated how different definitions of “mentions” or “citations” produced wildly different results. In a test of 7 tools side-by-side, Imoto found that the gap between the lowest and highest number of reported citations was 8.2x.
The IAB has documented the same problem at the industry level, noting that 20+ vendors now produce “materially different results” for the same brand.
Each tool defines visibility differently. Without detailed knowledge of how each tool defines its metrics, it’s difficult to know what the metrics actually mean. That’s precisely why Imoto ends up recommending marketers choose the definition of AI visibility they want first, then choose a platform that uses that definition.
On top of that, accuracy issues likely affect many tools. Speaking from personal experience, accurate entity resolution and source attribution is harder than it sounds.
As Dave De Vries wrote for ONMetrics:
Extractor accuracy — and especially the false-negative rate, brands that were named but missed — directly scales every downstream number, and is essentially never published.
Definitions and extraction accuracy can improve over time. Metric definitions may converge as the discipline matures. Leading tools will emerge and solidify their position, improving precision as they grow and become more sophisticated.
However, there are some challenges to measuring AI visibility that are more pronounced and harder to observe than in traditional SEO monitoring. Platforms and marketers have a natural incentive to chase “accuracy,” but accuracy in GEO/AEO may be poorly understood.
We should distinguish between two kinds of accuracy here:
- Accuracy within the monitoring platform, i.e. does the tool accurately process the text of the LLM’s output. This is easy to test: hand-check a sample of answers against what the tool recorded.
- Accuracy with respect to a brand’s AI visibility, i.e. does the data accurately represent how visible the brand is in AI answers. This is hard to test, because the tool cannot see what real users saw at scale.
This article is about the second.
Accuracy requires a defined target. In this context, that target might be expected brand exposure across a specified distribution of users, prompts, platforms, and time. Current tools observe only a vendor-defined sample from that distribution, while much of the actual population remains unknown. There is therefore no universal visibility number that tools directly observe or can currently validate against.
This is what makes the second kind of accuracy fundamentally different from the first. A tool may process every answer it collects perfectly while still providing an uncertain estimate of the brand’s broader AI visibility. The question is no longer whether the recorded data matches the observed answers, but whether those answers adequately represent the much larger population the metric claims to describe.
That representativeness problem is especially difficult because the AI visibility measurement surface is inherently unstable. The prompts people use, the answers platforms generate, and the systems generating them all vary in ways that are difficult or impossible for monitoring tools to observe. This instability also has downstream effects on reporting and attribution for which there are no clear solutions.
We can sort the main problems into two stages.
- Challenges to measurement
- Underlying model changes: model and tooling updates have significant impacts on LLM behavior at all stages, which can shift the underlying search surface unpredictably.
- Personalization and non-deterministic output: personalization has an impact on retrieval and output, but it’s difficult to measure how much.
- Challenges to attribution and reporting
- Changes in user behavior: zero-click behavior in AI search represents a hurdle for connecting AI visibility to business outcomes.
LLM updates change behavior and happen frequently
Key Points:
- Underlying models and tooling change frequently. Just in the past year, we’ve seen dozens of substantial changes in retrieval, citation, and output behavior.
- AI vendors are incentivized to provide constant updates and improvements. Google search frequently changes its algorithm, but AI vendors are specifically incentivized to introduce sweeping, drastic changes at regular intervals.
Model updates often result in drastic changes in retrieval and output
David Konitzny of Peec AI reported that after GPT-5.6 became the standard model for all ChatGPT users, several substantial changes happened all at once. Source counts doubled overnight, product pages displaced listicles as the most common type of owned media citation, and fan-out queries increased in number and specificity, with site: search modifiers appearing in 43 percent of fan-out queries under GPT-5.6, up from effectively zero under the previous model.
Another example. Profound documented a single unannounced ChatGPT change, rendering brand names as inline hyperlinks, that nearly doubled OpenAI referral traffic overnight and shifted homepages from roughly 4 percent to 24 percent of referral clicks within a week. Their conclusion generalizes: “OpenAI can move this number again at any time.”
Platform-level model swaps behave the same way. When Google quietly replaced the model behind AI Overviews with Gemini 3, Ahrefs found that the share of citations drawn from top-ranking results fell from roughly 76 percent to 38 percent across more than 860,000 SERPs studied, and SE Ranking tracked nearly half of previously cited domains disappearing within days.
While the specifics of change may be interesting to practitioners, the key thing we want to draw attention to is the pattern: the ground shifts often and without warning, leading some to adopt a reactive posture of trying to adjust to every unexpected change.
At reporting time, it is hard to show a strategy is working when metrics swing on model changes alone.
Model updates are a growth strategy
AI vendors have an economic incentive to make large, sudden changes. Model updates are how AI vendors compete for adoption, and adoption is the variable their entire investment case depends on.
Vendor economics assume far deeper paid adoption than exists today. Sequoia Capital’s widely cited estimate puts the revenue gap at $600 billion; Bain & Company, more recently, estimates the industry will fall $800 billion short of the annual revenue needed by 2030.
AI vendors need to convert experimentation into regular usage, and capability releases drive that. ChatGPT doubled its weekly active users in under six months, with each acceleration following a major release. In live API traffic, OpenRouter found reasoning models went from negligible to more than half of token volume within months during 2025. Models that stagnate lose share to those shipping updates.
Vendors are under pressure to move fast. Each major release tries to convert users before revenue has to catch up with capital commitments.
Enterprise APIs may stabilize through version pinning and deprecation schedules. But visibility tools measure consumer surfaces: free ChatGPT and Gemini, Google AI Mode, Perplexity. Those are still competing for adoption, so expect unannounced changes.
Google search doesn’t share these incentives
Traditional search changes constantly too, but in a different way. By Google’s own accounting, Search receives around 5,000 updates per year, most of them unannounced, and Google describes the overwhelming majority as small, tested, and generally unnoticed.
Substantial core updates arrive only about three times a year, are announced in advance, and roll out gradually over days or weeks. While there are multiple historical examples of algorithm changes that had substantial impact on search rankings, most changes are additive and cumulative. On the other hand, when an underlying LLM changes, retrieval and output behavior may look completely different overnight.
Traditional search is also dynamic and personalized, but it offers a more mature measurement layer, more stable result objects, and substantial first-party reporting through Search Console. Consumer AI answers combine a less observable surface with greater response-level stochasticity.
For anyone measuring visibility, the practical consequence is the same either way: the surfaces we measure will continue to change substantially and often.
Non-deterministic behavior and personalization affect results
Key Points:
- Most tools use UI scraping to get answers more similar to real user outputs.
- Personalization layers are on by default in some consumer-facing LLM UIs.
- Personalization affects retrieval at the query rewriting stage, and may affect source selection.
- Personalization affects output, but we have limited means to empirically measure how much.
- It is therefore difficult to gauge how representative UI-scraped answers truly are of real user experience.
Non-deterministic behavior is the fundamental challenge
UI scraping is considered the most accurate data gathering method for AI visibility analytics because answers within the UI differ significantly from API responses from the same model. According to Surfer SEO, answers in the UI from all tested models tended to be longer than API responses, included more citations, and had as little as 4% source overlap and 24% brand overlap with API responses.
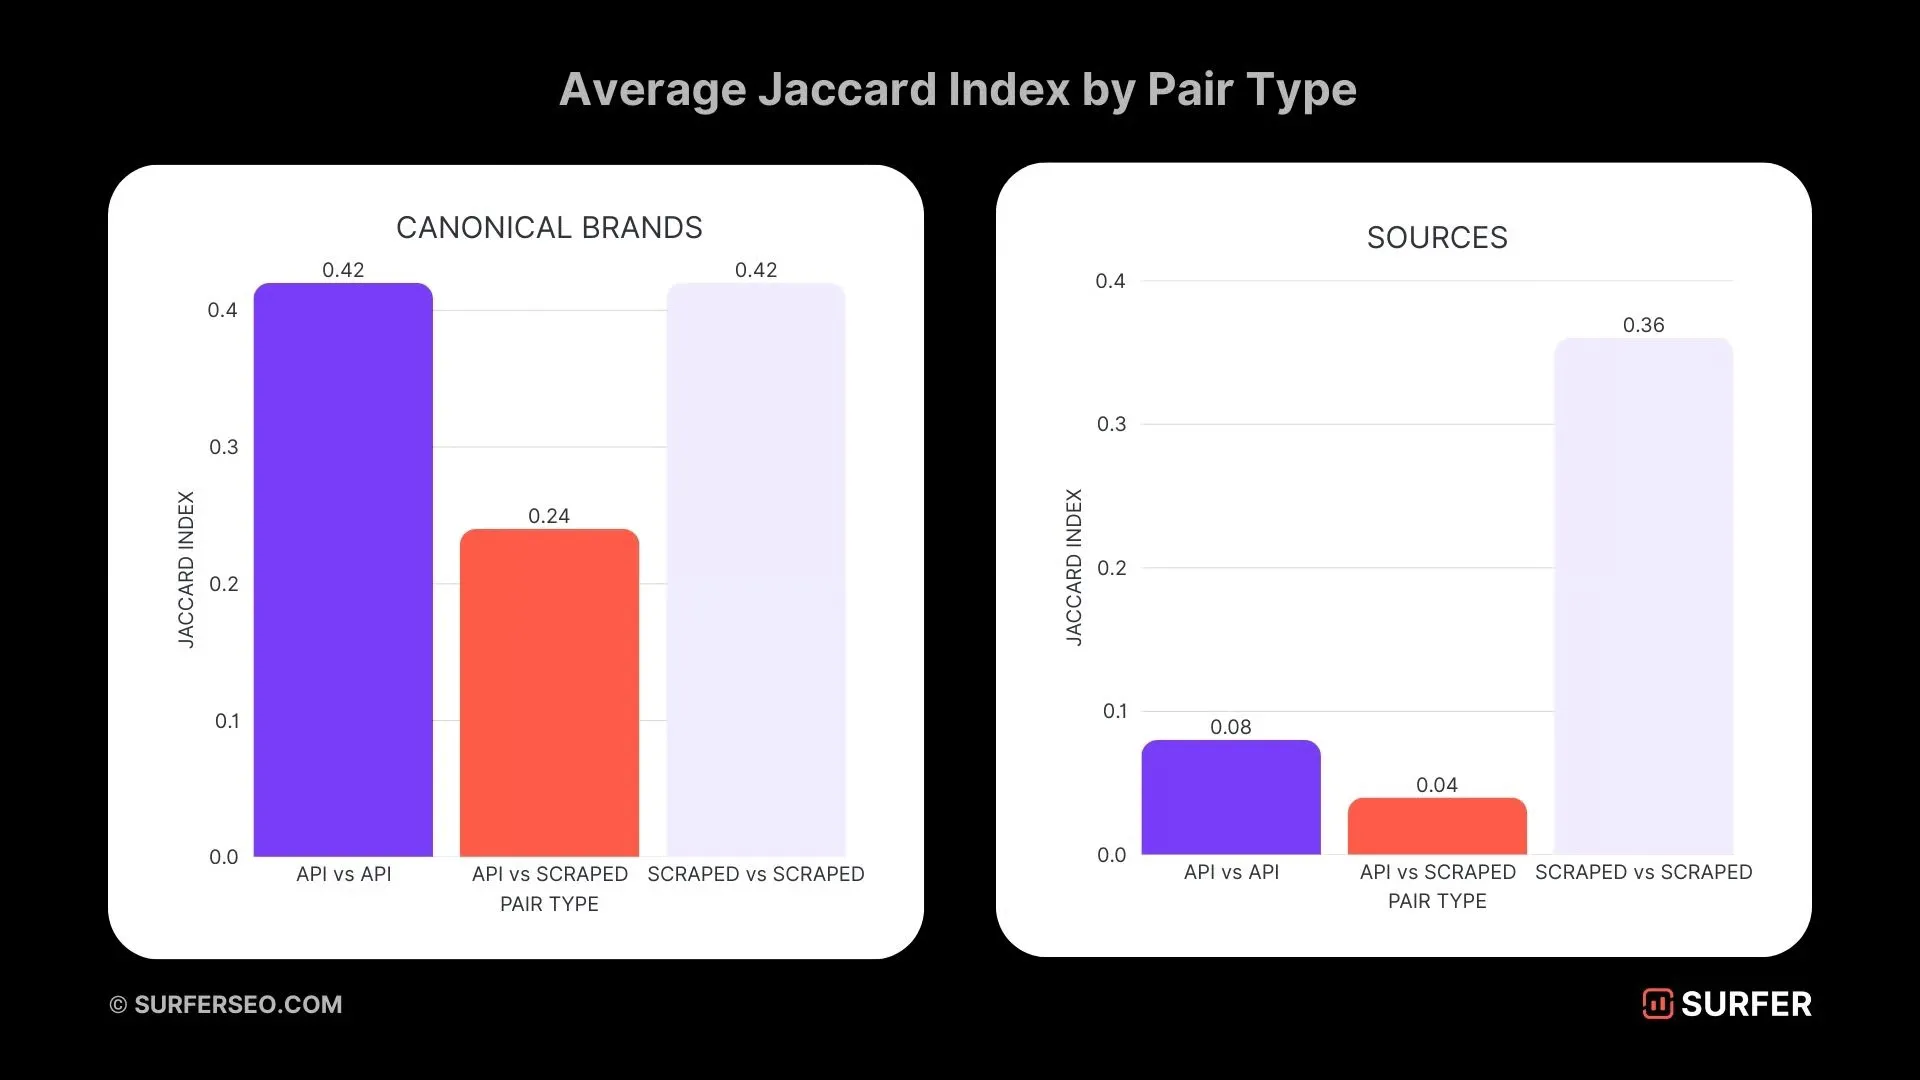
The goal of AI visibility measurement is to understand how likely a real user is to see the brand in an answer. LLM UIs include layers of hidden system prompts and tooling that have a significant impact on retrieval and output. If the average consumer is using an app or web UI to interact with an AI model, we should collect answers that are the most similar to what that consumer will see.
UI-scraping solves one part of the problem: consistent divergence between API and UI answers. But the number and cadence of scraping required to overcome sampling noise remains contested.
Stats nerds may note that even a Jaccard index of 0.44 for similarity between UI scrapes is at best moderate. Non-deterministic output is obviously a problem with measuring AI answers, and most tools deal with this by scraping answers at a regular interval, usually daily.
As economist Jennifer Zou recently argued in her article Is Once a Day Enough, scraping multiple times per day offers minimal accuracy gains compared to once per day.
Zou’s argument addresses how often to sample within a day, but not how many independent observations a reliable estimate requires in the first place. On that question, Schulte, Bleeker, and Kaufmann reach a blunter conclusion: “a single daily query cannot provide a reliable estimate of true visibility.”
Their analysis found that per-brand detection rates only stabilize at around seven to eight runs per prompt, and that with day-to-day source turnover near 65 percent, observation windows shorter than ten days cannot reliably distinguish signal from noise for individual brands. Their recommendation is to aggregate over rolling two-to-four-week windows before treating any per-brand figure as meaningful.
These findings answer different questions. Zou examines broad averages across a large prompt library, where once-daily scraping captures nearly all the accuracy available. Schulte examines stability at the individual brand or prompt level, where a single daily query cannot support a valid estimate. Both can hold: the library average stays steady while individual brand figures swing.
Regardless, most monitoring tools scrape once per day per AI platform. That is enough for library-level reads at that scale, but thin for per-brand claims. If your reporting and strategy work at the level of months or quarters, this is less concerning. But focusing on week-to-week changes is too reactive and volatile.
Personalization further confounds measurement
There is an additional, very important wrinkle. ChatGPT debuted its memory feature in February of 2024, and other providers soon followed with similar personalization features, some of which are turned on by default.
According to Dash et al. in a paper presented at the ACM Web Conference 2026, 96% of memories are created unilaterally by the system. Memory is not just stored user chats or inputs; it includes significant amounts of inferred information about the user created and managed by ChatGPT itself.
While empirical data about how much personalization currently affects LLM retrieval and output behavior is hard to come by, earlier work by Lazovich found that GPT-3.5 included or excluded facts based on user political affiliation.
Providers themselves emphasize that personalization affects output. In an April 2025 update, OpenAI claimed:
Memory in ChatGPT is now more comprehensive. In addition to the saved memories that were there before, it now references all your past conversations to deliver responses that feel more relevant and tailored to you.
Personalization also changes which sources are retrieved in the first place. Li et al. survey the RAG literature and show personalization is injected at the pre-retrieval (query rewriting) and retrieval (indexing, source selection) stages, not only at generation.
While the exact impact of personalization on retrieval in most major AI platforms is difficult to measure, OpenAI explicitly says it affects query rewriting:
If memory is enabled, ChatGPT may use relevant saved memories when rewriting a search query. For example, if you have shared that you are vegan and live in San Francisco, ChatGPT may search for “good vegan restaurants San Francisco” when you ask for nearby restaurants you might like.
Similarly, Gemini, AI Mode, and Perplexity all have personalization and memory features, with Gemini and AI Mode specifically drawing on the immense amount of user data available to Google across its multiple apps. However, many of these personalization features are opt-in, unlike ChatGPT’s.
We have almost no way to study how personalization works in a given LLM UI. A June 2026 study tried to evaluate consumer health LLMs under ordinary use and hit three walls: browser interfaces that can’t be reset to a clean baseline, models that change without version identifiers, and single-turn prompts that look stable while personalization emerges over multi-turn conversation.
The authors’ conclusion: no reliable independent evaluation framework yet exists for how these models behave in ordinary use.
There is a fair counterargument to all of this. Personalization may change very little for most queries, and a daily scrape might still produce a reasonable estimate of the average answer, the same way a poll estimates an electorate from a sample. That reading is plausible but unverifiable.
A pollster knows the sample size and can calculate a margin of error. A visibility tool sees only its own scrapes, has limited or no access to the answers real users receive, and cannot know whether its snapshot sits near the middle of the distribution or off to one side.
Without real-user variance there are no margins of error for representativeness, and without margins of error, “how accurate is this number?” has no answer.
Researchers have begun quantifying this uncertainty. One vendor-affiliated analysis found that differences below roughly 5–7 percentage points often had overlapping confidence intervals in its test setup. That range describes one study, not a universal noise floor.
Zero-click search makes reporting difficult
Key Points:
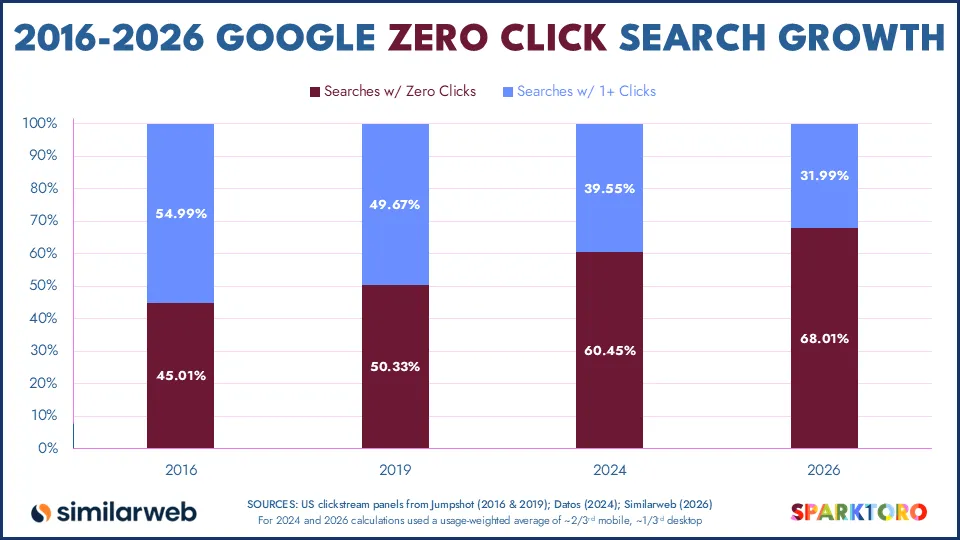
- Zero-click was already the norm, and AI accelerates it. Nearly 70 percent of Google searches end without a click, and AI answers cut remaining click-through roughly in half.
- AI-native surfaces are close to fully zero-click. Over 90 percent of Google AI Mode sessions end without any external click.
- Influence survives the missing click, but lands where analytics cannot attribute it. AI recommendations are associated with later branded searches and direct visits that last-click reporting records as something else.
- The signals that do exist are easy to misread in both directions, which is why context determines how any single number should be interpreted.
Rand Fishkin of SparkToro reported that “in the first four months of 2026, a whopping 68.01% of Google searches ended without a click.”
Users click less, especially when AI answers appear
Pew Research Center observed the actual browsing behavior of roughly 900 US adults across 68,000 searches. When an AI summary appeared, users clicked a traditional result in 8 percent of visits, compared to 15 percent when no summary appeared. Only 1 percent clicked a link inside the summary itself, and users who saw a summary were considerably more likely to end their browsing session entirely. Because Pew measured real sessions rather than modeled estimates, the finding is hard to dismiss.
Ahrefs’ updated AI Overviews research suggests the effect is worsening rather than settling: the drop in click-through rate for the top result has grown from 34.5 percent to roughly 58 percent as AI Overviews expanded. Seer Interactive’s September 2025 update adds a subtler point: organic click-through fell around 41 percent year-over-year even on queries where no AI Overview appeared.
Not every study agrees on size. Semrush found zero-click rates held roughly steady on keywords that gained AI Overviews, likely because answer-style queries rarely produced clicks to begin with. The size of the effect depends on which queries you examine.
AI-native search shows where this ends. Semrush and Datos found that 92 to 94 percent of Google AI Mode sessions end without any external click. On the surfaces AI visibility optimizes for, a session-based analytics model registers almost nothing at all.
Influence happens in the answer. Outcomes happen in sessions and transactions. Reporting sees the second, not the first.
Influence remains, but analytics cannot attribute it
AI visibility still influences business. The impact is recorded elsewhere.
A June 2026 vendor-authored preprint joined proprietary opt-in clickstream data with the same users’ conversations in ChatGPT, Claude, and Gemini. The authors do not disclose the total panel size.
In the seven days after an assistant recommended a brand, same-name searches were 4.3 percentage points higher than in matched earlier periods, and visits to the brand’s site were 2.4 percentage points higher. Direct click-through from the conversation, meanwhile, was negligible. The events were associated: by the authors’ account, by the time a query or pageview is logged, the influence is two steps upstream and unrecorded.
Practitioners observe the same pattern. An analysis of 94 ecommerce sites found ChatGPT-referred visitors converted 31 percent better than non-branded organic visitors while producing under 2 percent of revenue, with a familiar attribution path: the assistant recommends a product, the user Googles the brand, and the eventual sale is recorded as branded organic search. One agency case study measured the gap directly: last-touch analytics credited AI search with 0.9 percent of conversions, while buyer surveys attributed 9 percent.
In those journeys, last-click reporting credits the later visit, not the AI answer. What remains unknown is how common those journeys are.
This is harder than traditional brand measurement. A billboard shows the same creative to everyone who passes it, and it stays up for weeks. An LLM answer is regenerated for every query, shaped by memory and personalization layers, and assembled from a source pool that shifts with every model update.
The impression itself has no fixed form. Even flawless attribution would leave us unable to say what a given user actually saw, because the artifact existed differently for each user and leaves no record behind.
The numbers that survive are easy to misread
The limited signals that do reach analytics look encouraging. Semrush values the average LLM-referred visitor at 4.4 times an organic visitor by conversion rate, and Microsoft Clarity found similar multipliers across more than 1,200 sites.
But leading with either number produces opposite errors. Conversion-rate multipliers overstate the channel’s current contribution, since small traffic volumes make the ratios unstable: a handful of extra conversions swings the multiple. Traffic and revenue shares understate it, since attribution losses compound precisely on this channel. Both numbers mislead without context that dashboards do not carry.
What practitioners can do to address these challenges
The most common reporting metrics tend to be related to brand mentions. Sometimes the metrics are modulated by factors like sentiment or position-in-answer, but the core association tends to be mentioned = visible.
Barry Schwartz captured the situation during a recent Semrush webinar: “It’s billboard SEO now. How do we measure billboards?”
The answer much of the industry has converged on, to look at overall visibility and brand mentions, reflects a natural instinct. It makes sense as a provisional posture, but it is not a resolution.
Visibility metrics are read off surfaces that shift substantially and often. They are gathered by scraping interfaces whose answers may not represent what any given user actually sees. And they do not, on their own, connect to the business outcomes that leadership reporting depends on.
So what can we actually do? It is likely worth it to keep an eye on platform changes. AI platforms may ease some of these problems, like how Google recently added more links to websites in AI Overviews. However, planning a 6-month strategy cycle around what the model is doing this week is a bad idea.
For model changes: do not over-index on whatever type of content is performing well right now
Just because listicles, or buying guides, or Reddit posts are over-represented in AI citations right now does not mean you should direct your entire content strategy towards them. A diverse content strategy holds up better when retrieval behavior shifts.
A longer campaign affords you more data to compare against. Look at general, longer-term patterns of citation in your specific target niche. Owned media content is more important in some niches than others.
Long-run observation with the same tool identifies durable features of your niche, such as which content types earn citations in it. What it cannot support is precise month-over-month performance claims, because the instrument keeps changing underneath the measurement.
Use long windows to choose strategy and short windows to check execution.
Avoid going all-in on any particular type of content. Focus on a well-rounded strategy that balances rich on-page signals, first-party content, UGC, and earned media content.
For personalization: build your prompt library around the real language used by your ICP
Many GEO/AEO analytics platforms offer “prompt volume” data. But as many people have noted, provenance is uncertain and most figures come from questionable extrapolations of clickstream or search volume data. Each analytics vendor uses their own model to supplement and extrapolate the data.
Our position is that the thin data and heavy massaging required render prompt volume data highly misleading.
The lack of accurate prompt volume data compounds the issue with personalization that we already discussed. There is no reliable way to know what people are prompting, and no reliable way to know your tool returns a similar answer to what a given user sees for the same prompt.
You can work around personalization by targeting the ICP that personalization is likely already acting on.
Most established companies will have a wealth of data to mine for exactly how their customers talk: sales calls, customer support requests, and customer emails. Supplement that with language from UGC platforms like Reddit, YouTube, and LinkedIn (or wherever else your customers hang out). Finally, inform some of your prompts with SEO search volume data. All of this immediately puts you much closer to the types of questions your customers are likely asking.
While this is only an educated guess, given how little we can measure personalization, prompts in the voice of an ICP may match what personalization already does.
For example, if a user has chat history with ChatGPT asking for a running routine for new runners, then, in a new thread, asks for running shoe recommendations, ChatGPT may modify its retrieval behavior in fan-out queries to search for “best running shoes for beginners”.
You can approximate this by adding these audience-specific modifiers yourself.
For attribution: use proxies as a basket, not benchmarks
There is no complete, generally available attribution method for AI exposure.
That leaves proxies, each flawed in a familiar way.
Branded search rises when AI creates demand, but it rises when anything works. Direct traffic picks up some of these buyers, but it moves for other reasons too. Surveys catch what analytics misses, but buyers misremember or neglect to answer.
No single one proves anything. When all three move together, measured the same way each time, you can be confident the work is creating demand.
Run all three under one method and read direction, not ROI.
One agency case study measured the gap directly: last-touch analytics credited AI search with 0.9 percent of conversions while buyer surveys attributed 9 percent. The two figures measure different things: recorded conversions and remembered influence. Neither is a precise ROI figure.
Treat all attribution numbers as a basket with the caveats attached, not as a precise ROI figure.
Recommended reading
- IAB, Measuring Visibility in the AI Era (August 2026)
- Probably the best attempt so far to systematize the practice of AI Visibility measurement and optimization. Their proposed Provider Disclosure Framework in particular is a great proposal to help marketers make informed decisions about which tool to use. The entire thing is very much worth a read.
- Schulte et al., Don’t Measure Once
- This paper is by far the most rigorous analysis of the sampling frequency and cadence needed for measuring AI visibility. It’s a bit dense, but I think it’s worth a careful read for anyone who cares about the field.
Sources
Measurement disagreement
- Digiday, Marketers question AI visibility tools over inconsistent results
- Ken Imoto, I Plugged the Same Site Into 7 AI-Citation Trackers. They Reported 7 Different Numbers.
- IAB, Measuring Visibility in the AI Era (August 2026)
- Dave De Vries for ONMetrics, AI Visibility Tools & AI Rank Trackers: How They Actually Work
Model changes and vendor incentives
- David Konitzny (Peec AI), ChatGPT’s New Default Model GPT-5.6: More Retrieval, More Fan-Outs, More First-Party Content
- Profound, Is Zero Click marketing dead? The branded link update
- Ahrefs, Update: 38% of AI Overview Citations Pull From The Top 10
- SE Ranking, Gemini 3 Rollout & Google Bug: Here’s What Changed
- Sequoia Capital, AI’s $600B Question
- Bain & Company, $2 trillion in new revenue needed to fund AI’s scaling trend
- TechCrunch, ChatGPT doubled its weekly active users in under 6 months, thanks to new releases
- OpenRouter, State of AI 2025: 100T Token LLM Usage Study
- Search Engine Journal, Google Defends Lack Of Communication Around Search Updates
- Google, How Google updates Search to improve our results
Personalization and sampling
- Surfer SEO, Scraped AI Answers vs. API Results from LLMs. Is There a Difference?
- Jennifer Zou (Profound), Is once a day enough?
- Schulte, Bleeker, and Kaufmann, Don’t Measure Once: Measuring Visibility in AI Search (GEO) (arXiv:2604.07585)
- OpenAI, Memory and new controls for ChatGPT
- Dash et al., The Algorithmic Self-Portrait: Deconstructing Memory in ChatGPT (arXiv:2602.01450)
- Lazovich, Filter bubbles and affective polarization in user-personalized large language model outputs (arXiv:2311.14677)
- Li et al., A Survey of Personalization: From RAG to Agent (arXiv:2504.10147)
- OpenAI Help, Searching the web with ChatGPT
- Google, Personal Intelligence from Gemini — AI help just for you
- Google Support, Personal Intelligence: How AI Mode in Search personalizes responses for you
- Perplexity, Introducing AI assistants with memory
- Testing the Black Box: Structural Barriers to Independent Evaluation of Consumer-Facing Health LLMs (arXiv:2606.08483)
- Quantifying Uncertainty in AI Visibility: A Statistical Framework for Generative Search Measurement (arXiv:2603.08924)
Zero-click and attribution
- Rand Fishkin (SparkToro), In 2026, Less than One Third of Google Searches Still Send a Click
- Pew Research Center, Do people click on links in Google AI summaries?
- Ahrefs, Update: AI Overviews Reduce Clicks by 58%
- Seer Interactive, AIO Impact on Google CTR: September 2025 Update
- Semrush, Semrush Report: AI Overviews’ Impact on Search in 2025
- Semrush and Datos, Google AI Mode’s Early Adoption and SEO Impact (also cited for the Schwartz webinar quote)
- From Prompt to Purchase: How AI Brand Recommendations Move Consumers on the Open Web (arXiv:2606.10907)
- 180 Marketing, ChatGPT Traffic Converts 31% Better than Non-Branded Organic Search (94 eCommerce Sites Analyzed)
- Alchemy Leads, How to Solve the AI Search Attribution Funnel
- Semrush, We Studied the Impact of AI Search on SEO Traffic
- Microsoft Clarity, AI Traffic Converts at 3x the Rate of Other Channels (Study)
- Ars Technica, Course correction: Google to link more sources in AI Overviews
- Jäckert-O’Daniel, Prompt search volume: Real data or all guessed?
- Gavin Hewitt, LLM Search Volume Data Estimates are Guesswork (LinkedIn)
- SEO Notebook, The Problem with Prompt Volume